Introducing CaRPM. Our new look!

We’re incredibly excited to introduce you to our latest design! A huge thanks to everyone involved for making this possible. We really appreciate your support.

Our aim at CaRPM has been to help you understand your car better and make car ownership easier. With an OBD-II scanner installed, you can help yourself to the data that your car holds. If you have any questions about the scanner, feel free to contact us (call us through the app itself) and we’ll get right to it.

To help you through the new design and the little things here and there, we thought we’d give you a short walk-through. Some features have remained the same while others have been improved upon to give you the best support while you enjoy driving your car.

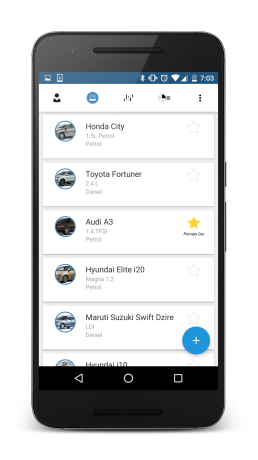
1. Garage and Car Profile: Find and select your primary car and use the CaRPM app to track when to renew your insurance, when your servicing is due, etc. You can also get a better idea of your car’s health by entering the age of your car.

Garage_framed.png

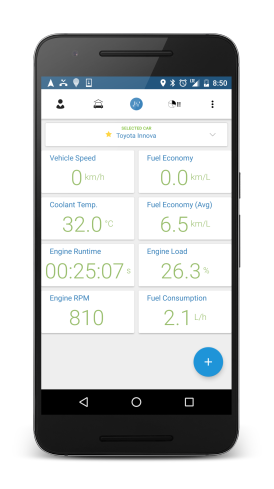
2. Live data: There’s a LOT more data you can view on your dashboard. You can select what data you want to view on your dashboard while you drive.

Live Data_framed.png

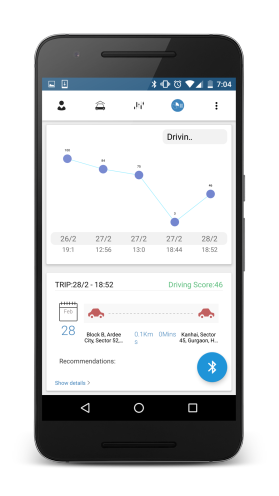
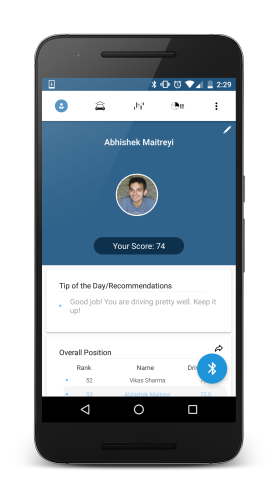
3. Driving score: Based on your driving, we analyse your driving pattern and generate your score on a 100 point scale. Not only this, we recommend tips for better driving and increasing your score.

Usage_1920

4. Invite your friends: You can invite your friends and compare driving scores and FINALLY answer “Who’s the better driver?”. Compete with your friends and get daily tips and suggestions to improve your car’s health!

User Profile_framed.png

Besides these, there are a lot of small features that we’ve added to make your driving experience better and owning a car easier and more affordable. Do try them out!

Of course, your inputs are extremely valuable for us to be able to serve you better. So please let us know what you think about the app and we’ll get back to you on it. Write to us at fix@carpm.in with your feedback and who knows, maybe you’ll get early access to our new features for helping us improve!

Download the CaRPM app here

Share with your friends & family and help them turn their car into a smart car!

Parents key in Teen Driving

Parents play a critical role in influencing teen driving behavior. They are vital role models whose impact makes teens more receptive to learning and gaining useful experience.

It’s more than just good parenting; it’s a matter of life and death. Parents need to talk to their kids about traffic safety early and often – before they reach driving age.

Teen-Driver-Safety

Set the Standards

Talk to your teen about safety issues and the rules you are setting. Explain each rule and the possible consequences of breaking it. It is crucial that teens and parents are on the same page about driving rules and the dangers of the road.

Most importantly, your kids look at you while you drive so make sure you follow the rules as well.

Practice Makes Perfect

­

Parents need to make sure that their teens get an ample amount of driving practice in as many situations and conditions as possible. This in turn will help them develop the necessary skills and experience that all young drivers need behind the wheel.

Share your wisdom

Share stories, experiences, and things that have happened to you that will shed some light on certain situations.

Spell out the rules

The Car

  1. The car you choose should have a driver’s side airbag and a good safety rating.
  2. Good car care: refuelling when needed, oil changes, tire pressure, and regular maintenance. Also, keeping the car free of clutter and trash.

Safety

  1. Always obey the speed limit and traffic laws, and always wear seat belts. Make sure passengers are buckled up as well.
  2. Let you know where they are coming and going.
  3. Never use cell phones while driving.
  4. Never engage in drinking or drug use.
  5. Have a realistic curfew. Night driving is especially difficult for a new driver.


Double Battery, Single Power? :P

No, we aren’t taking a dig at bespectacled people, we are just talking about boring car batteries 😛

battery

One of the worst things to face, when you own a car, is when the battery runs out unexpectedly. Not all cars have an indication when the battery is at low levels and usually, they run out before action can be taken.

So, it becomes important to get your car battery checked every time it goes for servicing right? Here’s the catch though. Most times, battery checks aren’t included in servicing and that means that your battery may give out without warning. There are a few signs that your battery is getting weaker.

  1. Problems with ignition
  2. Headlights seem dim at idle but get brighter when you rev the engine
  3. Inefficient cooling in the cabin

Massive use of the battery for air-conditioners, music systems, headlights, etc. can weaken it. Using these in the idle condition can further deteriorate the battery.

Here are a few things to keep in mind to maintain the health of your car battery:

  1. The most important thing is to actually drive the car occasionally. The alternator recharges your battery when it is being driven and this maintains battery charge.
  2. Frequent starting cycles with short run times drain the battery below the ideal charged specification. So avoid unnecessarily turning the car off.
  3. Periodically inspect the battery for shell cracks, fluid leaks, etc. Check the fluid level of the battery to ensure full fluid level.
  4. If charging a battery connected to a vehicle, be sure that the vehicle’s electrical system has protection against overvoltage or be sure that the charger will not have high-charging voltages that may damage the vehicle’s electrical system.
  5. Disconnect the connector from the negative terminal of your battery if you know the car will not be driven for two weeks or longer. This will help prevent a gradual loss of charge from powering the vehicle’s clock, and other passive electrical items.


However, the best tip for maintaining the battery is ensuring that it is regularly checked, the connections clean and free of rust and dirt and the car driven regularly. Follow these and you probably wouldn’t have any problems starting your car once again.


Car modifications to boost its performance

images

For a lot of enthusiasts, their car may not be exactly how they’d like it to be. Some feel that manufacturers even tune down cars for commercial reasons. And that’s when they start discovering car modifications.

Ordinarily, an engine works this way: A piston moves down, creating a vacuum, allowing air at atmospheric pressure to be drawn into the combustion chamber or cylinder. Combined with fuel, chemical energy is turned into kinetic energy through combustion. This forces the piston up, which in turn rotates the crankshaft and provides the drive for the car.

Though some people view performance modifications as a justification to increase fuel consumption, that isn’t true. Fuel economy is relative to performance. And the basis for better performance is more efficient combustion in the engine. So here are some modifications that may help your car perform a little better:

1. Cold Air Intake  

Difficulty of installation: Easy

The temperature of the air can affect the efficiency of your car. A cold air intake kit is an aftermarket system that brings cool air into the  engine. Normally, a car regulates the temperature of air as it enters the engine. Cold air intake kits, however, can lead to higher performance and engine efficiency, based on the idea that colder air is denser than warm air, which means that it contains more oxygen, necessary for more dynamic combustion in the engine.

2. Cat-Back Exhaust

Difficulty of installation: Medium

If you do an intake upgrade, it’s a good idea to upgrade your exhaust. A cat-back exhaust system entails everything after the catalytic converter but do check the legality of changing one in your location. Cat-back exhaust systems aren’t necessarily loud. With the use of resonators and mufflers, it can still be high-flow and lower-volume. But it’s safe to assume it will be significantly more noticeable than your stock exhaust system.

3. Air Filters

Difficulty of installation: Medium

Aftermarket air filters allow for more airflow into the engine for a more efficient use of the air/fuel combination, while also blocking contaminants and impurities that slowly degrade performance over time. Secondary air filters are generally made up of a thin layer of cotton or other material housed between several layers of impurity-catching thin mesh. High-quality aftermarket air filters drop into the engine’s air box, and that’s about it for installation. And because they’re made of fabric, they’re washable.

4. Spark plugs and wires

Difficulty of installation: Easy

Although not so much a modification as it is a general maintenance tip, spark plugs and wires can affect engine performance in the long run. Spark plugs wear out over time as their conductive elements erode away and force your ignition coils to do more work to produce a “hotter” spark. Wires also make a big difference due to electrical resistance and insulation to causing interference. The cost for this is modest and can be easy to do on your own, therefore it pays to do this once every 80,000 km or so.


WARNING: Ensure that you check your manufacturer’s warranty before making any changes to your car. Although most changes can be made without voiding the warranty, it is still safer. Also, don’t make too many changes all of a sudden. Analyse what performance parameters you want to improve and what is the best way to do that. That way, you save money and the trouble.

Why is the Diesel Ban important?

The Odd-Even experiment is long gone but the Supreme Court of India has ordered that the ban on registration on new diesel vehicles with an engine capacity more 2000cc must remain till April 1, 2016.

diesel car

This ban follows more or less the same logic as the Odd-Even experiment; it is centered around the degrading air quality in Delhi. But it is more than just this debate, and that is where the ban becomes important. The plea to remove the ban was put forward by leading automobile manufacturers such as Mercedes, Toyota and Mahindra & Mahindra. The idea being put forth is that new diesel engines do not pollute more than petrol engines because they are designed based on a “new technology”.

Diesel-driven vehicles account for over 90 per cent of SUVs in the country, 34 per cent of small cars and 70 per cent of large/medium cars. With so many diesel cars on the road, and the exponential increase in the market in recent years, they are under scrutiny for good reason.

Although, traditional literature claims that diesel engines pollute less, that isn’t exactly the case. Diesel engines emit lesser carbon monoxide, carbon dioxide and hydrocarbons. However, they produce more particulate matter than petrol engines. Most diesel engines now use catalytic converters for engine efficiency (and reduced emissions). The converter is most efficient at temperatures above 250 degrees Celsius. Here lies the second problem; most vehicles don’t achieve the 250 degrees needed by the catalytic converter. Which is probably why  a report from the Norwegian Centre for Transport Research found that a modern diesel car pumps out more toxic pollutants than a bus or heavy truck.

The amount of time it takes for the diesel engine to warm up to that level is mostly only achieved by buses. And buses don’t use catalytic converters.

Another factor to examine is the quality of diesel fuel with respect to the amount of Sulphur, which is often much higher than acceptable.

Though most manufacturers claim that diesel engines are fitted with an exhaust re-circulation system (to burn partially burnt exhaust from the engine and reduce emission), the system itself is pretty expensive. Most manufacturers also wouldn’t make a profit by designing engines with higher injecting pressures.


Therefore, it isn’t unnatural to assume that the diesel ban is also a challenge to automobile manufacturers to prove that they live up to the promises made by them with regard to their technology. Following the VW scandal, the ban is a test for the manufacturers and, in a larger sense, to the corporate profit-making mindset that disregards safety norms. And that is why the diesel ban is so important.


The checklist before your very own road trip

So you’ve packed your bags, called shotgun and set your sights at the destination.You know that it is going to be a long drive and your car might require some help along the way.

znmd1

But what exactly must you be sure of besides fuel in the tank? Here’s a short checklist to go through before you leave for an adventure:

  1. Car health: Probably the most important aspect is to know your car’s health before you begin. This includes everything from simple maintenance to brakes, suspension and the secrets under the hood.
  2. Chart your ideal route: Use a good map to chart the optimal route, preferably one with rest stops and fuel/repair stations along the way. This adds safety as well as takes care of accidental breakdowns on the way.
  3. Make sure you’re carrying all you need: This includes jumper wires, a spare tire, car jack, wheel wrench and basic tools. Also, ensure that your spare tire isn’t punctured and has adequate air by measuring pressure.
  4. Designated drivers: Unless you’re driving alone, never drive for a long stretch yourself. Change drivers so that you can get some rest and minimize stoppage time. This also allows you to inspect the car after a few intervals and change plans accordingly.

While you’re driving, there are other things to keep in mind as well. Some of these are general, but they should be mentioned anyway:

  1. Clean mirrors and glasses regularly: Make sure the windshield and mirrors are clean at all times. A hack here would be to use a newspaper after cloth to clean the window since it leaves no marks.
  2. Night driving: Night driving isn’t easy and is only recommended on routes that you know very well. However, the engine heats up less and can give a better performance at night. But still, be careful while considering this point.
  3. Keep an eye on engine data: Keep an eye on the engine data, fuel level indicator, etc while you are driving to be able to know what to expect.
  4. Don’t over-fuel: Don’t fuel your car more than required since the fuel may spill over or a vacuum may be created which doesn’t allow the pump to suck the fuel.

And there you have it. Your very own travel checklist that ensures a safe and smooth ride. Hope you enjoy the experience that the road brings!! 

Odd-Even Rule: The Final Word

On Friday night, 8:00 p.m., the 15 day Odd-Even experiment ended in the nation’s capital. Amidst great support by the population of Delhi, Chief Minister Arvind Kejriwal congratulated everyone for the success of the experiment.

But did the experiment really succeed?

Let’s take a look at some of the findings of the experiment.

w_pollution

During the experiment, the highest P.M. 2.5 level recorded was 400 µg/m3 as opposed to over 600 µg/m3 in December, according to Delhi transport minister Gopal Rai.

True that this indicates a significant improvement in air quality but Delhi is still far from the mark of the optimum 60 µg/m3 (as suggested by the Delhi Pollution Control Committee). The takeaway being that:

  • the odd-even rule should be applied longer
    OR
  • the odd-even rule can only affect pollution so much

The bad news is that most experts are bent towards the second observation. The Council on Energy, Environment and Water (CEEW), an independent think tank, said that there is no conclusive evidence to prove that the odd-even policy improved Delhi’s air quality.

Collaborating with the Energy Policy Institute at the University of Chicago, the CEEW independently measured air quality and traffic volumes at five locations: Connaught Place, GTB Nagar, IIT Delhi, Mathura Road and Shadipur.

An analysis of the data collected indicates that the average air pollution levels increased in the first week of January compared with the previous week. However, in the second week of January, air quality was marginally better, but still poorer than the last week of December. (CEEW also claimed that their readings were almost identical to those of the pollution monitors installed by the Delhi Pollution Control Committee).

An average PM2.5. level of 306 µg/m3 was recorded during the first two weeks of January 2016. The average level of P.M. 2.5. recorded during the first two weeks of January 2014 was 330 µg/m3.

The problem, as the think tank put it, is that conclusive evidence was very hard to provide for the experiment given the meteorological variables of wind speed, temperature and precipitation.


Congestion: Traffic congestion was visibly lower in most areas. The reasons for this being that people largely followed the rules imposed (9,140 offenders in 15 days, or 609 per day). Metro ridership went up by about 1,50,000 people per day whereas bus ridership increased by 14,10,000 people per day.

However, there was a 10% increase in traffic congestion in the five locations mentioned above. This has been attributed primarily to a 17% increase in two-wheelers, a 12% increase in three-wheelers, a 22% rise in taxis and a 138% rise in the number of private buses during the experiment, as reported by the CEEW.


It isn’t a very clear image then. Some people have blamed the large exemptions to the rule for having failed the experiment whereas others have commended the government’s effort in successfully carrying it out at this scale.

There is also the large number of vehicles entering Delhi through surrounding areas of Gurgaon, Noida, Faridabad, etc. which contributes to pollution and traffic each day. Largely speaking, the odd-even rule has impacted pollution. But to be able to provide long term solutions for the same would require the government to take major decisions on Delhi’s public transport and infrastructure.


Odd Even Rule: Halftime analysis

411130-pti-delhi-traffic-odd-even.jpg

(source: dnaindia.com)

8 days of the odd-even rule in Delhi and reports indicate a largely positive atmosphere. Literally.

According to the Delhi government, P.M. 2.5 levels saw a consistent decline due to the odd-even rule in the nation’s capital. Delhi Transport Minister, Gopal Rai further told the country on Thursday that “In December, PM 2.5 was at an average of 400 to 465 (six fixed pollution stations) . The data of 18 locations taken yesterday was less than 300.”

At an average, the levels have dropped by nearly 100 points signifying a drop in pollution by 25%. The worst air quality was measured near Tajpur (294) whereas the minimum particulate levels were measured at Dhaula Kuan (161).

The repeated concern over the air quality in areas bordering Delhi continues to bother the government and officials. This may be due to a large number of commercial vehicles plying on these routes, moving in and out of Delhi.

However, areas within Delhi were showing significant improvement in air quality. This observation is significant also because it indicates the acceptance of the Odd-Even rule by the commuters traveling in and around the various CBDs in Delhi. We believe that this change represents a positive shift in the mindset of the commuters.

But that’s not all. Data claims that there has been a 30% reduction in traffic volume due to the implementation of the rule. The violations have generated Rs 40 lakh (as reported on 6th January) in challans. The traffic police, in this time, had booked 401 drivers whereas the transport department booked 207 offenders. In total, over 600 challans were issued by the SDM.

The police reported that traffic norms were largely being followed and there were areas where no challans were issued, also an optimistic report for the next half of the experiment.

The change has been visible in other sectors as well, with petrol and diesel sales down by nearly 25% since January 1, as reported by ET. The number of cars coming in for servicing and repairs have also dropped significantly.

The Metro and DTC have been largely successful in handling the additional volume of commuters. The influx has been matched by an increased frequency of operation in the case of the Metro, which has been carrying 32 lakh passengers and an increased number of buses on the road in the case of the DTC, which has been handling nearly 40-45 lakh passengers.

All this points to a largely positive second half for the odd-even formula in Delhi. Although violations have not exactly gone down, a large section of the public has accepted the experiment which seems to be helping in making a difference.

Does Delhi really have the worst traffic?

Delhi has the most number of registered vehicles (as well as millions of unregistered ones) of all Indian metros. In fact, the rise in the number of vehicles in Delhi has been phenomenal.

Data indicates that vehicular emissions has been on the rise ever since, overtaking domestic and industrial air pollution.

clip_image002_thumb22

(source: “Vehicular Pollution in India”, Smriti Chand)

However, if you look at the latest data of Numbeo, you will find that there are 3 Indian cities in the top 10 cities with the Worst Traffic Conditions in the World.

And Delhi is NOT one of them.

The ranking is based on a number of factors such as CO2 emissions, the average time spent by a commuter in traffic, estimation of time consumption dissatisfaction and overall inefficiencies in the traffic system among others.

The ranking includes various indices such as the Inefficiency Index, Time Index, Time Experience Index, Traffic Index, etc. which correspond to factors such as CO2 consumption due to traffic time, estimation of time consumption dissatisfaction and more.

Upon analysis of the report, one sees that Mumbai tops the list, along with Pune at 3rd position and Kolkata at 5th. According to the index, it takes a person an average of 66.18 minutes to reach his/her destination in Mumbai, 60.82 minutes in Pune and 58 minutes in Kolkata.

Other Indian cities feature on the list as well. Bangalore is in 19th place, Coimbatore in 21st, Delhi in 23rd, Hyderabad in 25th and Chennai in 49th.

pollution-table_650x310_41422525194

Having 8 cities on the list, India finds itself in 13th place on a traffic index by country beaten by countries like Kenya, Russia and Philippines.

This is not to say that Delhi does not have a serious traffic congestion problem. But with wider roads, a system of flyovers and underpasses and metro connectivity, Delhi does not, contrary to popular belief, have the worst traffic conditions in India.


The Odd-Even Rule: 2 day report

delhi-air-pollution-ep-prav

Today is day 3 of the Odd-Even rule experiment. Although it is too soon to tell whether the rule has been a success or not, preliminary reports and data indicate a largely positive scenario.

According to the data released by the Delhi Government, there was an expected dip in the emissions as measured in air quality. The concentration of PM 10 and PM 2.5 had both dipped after day 1 as compared to the concentration last year on the same day.

Even on day 1, a dip of about 10% in concentration of pollutants as noticed between 8 a.m. and 2 p.m.

An important observation after day 2 has been that areas in Delhi-NCR that border Uttar Pradesh showed higher pollution statistics than areas in and around central Delhi.

In areas like Dyal Singh College and colonies like Kasturba Nagar, a particulate matter value of 149 micrograms per cubic meter was seen.However, in colonies like Patparganj in East Delhi, the levels crossed 500 micrograms per cubic meter.

After day 2, at an average, PM 2.5 kept around 250 micrograms per cubic meter whereas PM 10 was in the range of 149-503.

However, the biggest positive has been the enthusiasm and involvement that the Delhi junta has shown during this experiment. Only about 200 offenders were fined on day 1. A similar trend was seen on day 2.

Active participation of the public is a must for the experiment to reveal accurate results. And the attitude of the Delhi junta seems to be positive.

If you are looking for someone to commute with during the odd-even scheme, then please visit delhi.carpm.in.